The ROI of Ranking in Google Search: How Organic Search Can Save You Thousands
SEO and content work, when at its best, provides a provably positive return-on-investment (ROI).
Predicting the ROI, however, can be difficult.
Some sites will try to project potential ROI for ranking in Google Search by looking at what ranking improvements mean in dollars and cents.
Some businesses can actually assign monetary values to each unique new visitor they earn thanks to great tracking in analytics; others can rely less on exact metrics like the cost-per-click (CPC) value of the same organic traffic.
Looking for a method of determining the ROI of your content and SEO initiatives? Read on to learn more.
Two Assumptions First
One way to estimate the potential value of a ranking improvement in real dollars is to project how much it might cost to acquire the same traffic with paid search.
Using this type of metric brings a few assumptions into the picture when making predictions.
Assumption 1: Paid Search Provides a Neutral or Positive ROI
If you help a client get 500 new users per month for a particular keyword, and that keyword has a CPC of $3, you could estimate these ranking changes create $1,500 per month in value.
Over the year, $18,000 of value would be created by this ranking change.
Here, you’d be using the CPC for the keyword as a proxy for its value to your client.
In truth, the client:
- Might never see a positive ROI bidding such a rate for that keyword.
- Or might gain a positive ROI bidding on that keyword with an even higher value.
This uncertainty limits how accurate you might be in predicting the value of influencing rankings for a particular keyword, but it provides a place to start and with estimations that can be helpful.
Assumption 2: You Can Predict What the Click-Through Rate of Different Search Positions Might Be
In order to predict how ranking increases might impact search traffic, there are a few approaches you can take.
This Advanced Web Ranking study can help by providing rough guidelines for click-through rates (CTRs) at different ranking positions.
There’s even data for CTRs across different industries.
If you want to know what traffic increases might be if you move a client from Position 8 to Position 3 on Google Search, you can calculate this as a function like so:
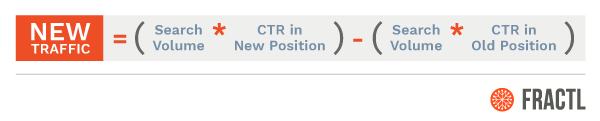
This calculation also assumes that search volume estimations are accurate, as reported by tools. If the client has reliable and detailed analytics, it may be possible to make much more informed calculations here.
Search results are increasingly complicated, which presents a range of problems. Result pages are no longer a list of 10 links.
Fortunately, you can isolate data to find the percentage of search results for any given domain that has results with alternative SERPs – which might include featured snippets, knowledge panels, video, local results, etc.
This data can help you more accurately project final growth possibilities, even if it does mean leaving out some keywords or manually reviewing certain SERPs to adjust best-guess CTRs if ranking improvements are achieved.
Despite these potential inaccuracies, collecting and analyzing this data allows you to move forward with rough calculations.
If a client can provide data about revenue and traffic volume via analytics – even at a high level – it’s possible to derive ratios that help you predict by what margin your calculations might be off.
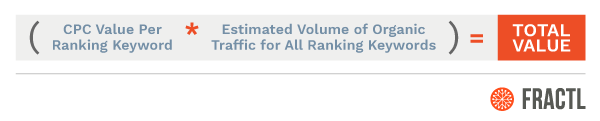
Calculating the Current Value of Traffic
Another way to gather similar data and develop calculations is to use a tool like SEMrush or Ahrefs.
This software provides an aggregate estimation of the value of search traffic for any domain, as well as per-ranking calculations when query results are exported.
This calculation is likely derived as described in the above section:
- Estimating CPC multiplied by the overall search volume.
- Then making estimations about a site’s predicted total organic traffic and summing the values for each ranking keyword.
Let’s look at Bankrate.com as an example. (I am not affiliated with Bankrate in any way.)
If you estimate the CPC value for each keyword Bankrate.com ranks for, then multiply that by the estimated volume of organic traffic it receives for each keyword, the total value would equal around $35 million per month.
In other words, if Bankrate.com were to pay for all its organic traffic (the same volume) in paid search, they’d need to spend $35 million per month!
Setting Appropriate Goals
Look at Recent Ranking Losses
When engaging with a new client, your goal is to provide as much immediate value as possible. This often means looking for “low hanging fruit” or opportunities to make provably positive ROI quickly.
One way to identify low hanging opportunities is to identify those keywords where ranking losses have occurred recently and to find ways to restore or break beyond previously held higher ranks.
Data from SEMrush or Ahrefs can be segmented to show keywords that have lost rankings over the past month.
You can extrapolate the value of these traffic losses in totality, grouped by URL, and also by individual keyword.
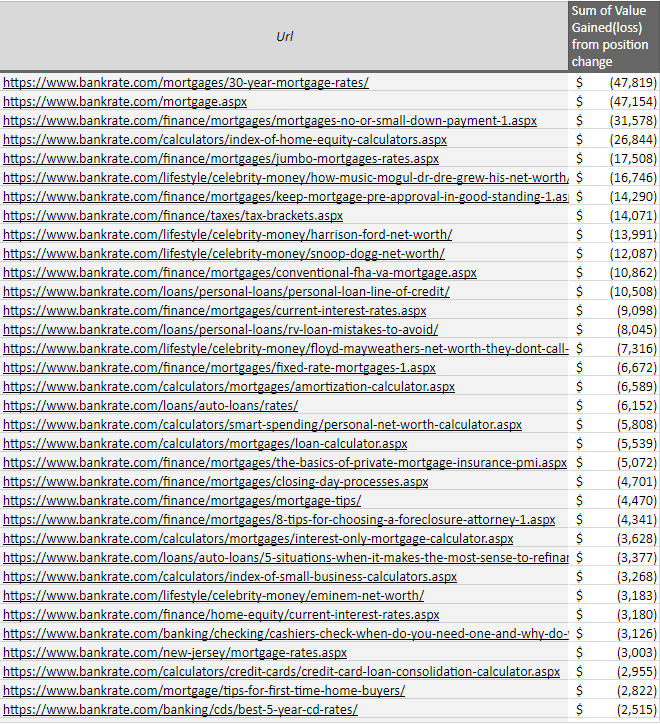
Look for Keywords and Pages with the Largest Recent Drops
If you look at the keyword rankings Bankrate.com lost in the past month, organized by those that had the largest potential revenue hit, you get this.
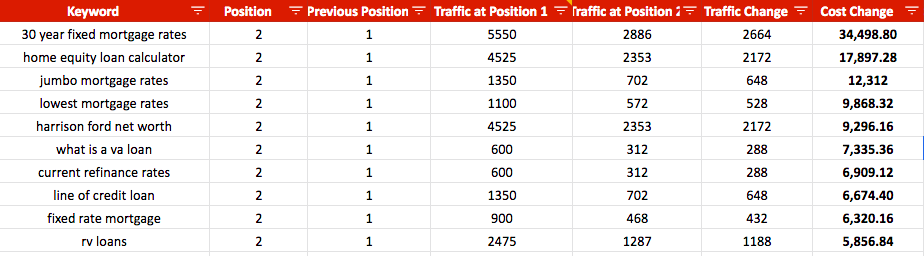
Looking at this data, you see that a ranking loss from Position 1 to 2 for these keywords resulted in over $100,000 per month in losses.
This could mean a million or more dollars in revenue over the course of a year.
One thing to consider in the above scenario is that you’re looking quickly at rankings for individual keywords attached to individual URLs.
You can take this a step further by analyzing what the net ranking losses are for pages across the domain.
This can allow you to find those URLs whose ranking dips brought the largest overall potential revenue loss. It also gives you a better picture of:
- What those losses (and gains) look like across all the keywords each individual page ranks for.
- How those fluctuations impact the business in aggregate.
It’s possible that some of the largest keyword ranking losses are also happening on pages that had the highest-ranking gains (for other keywords).
Your task is to find pages that used to do well across a keyword set, helping you narrow down pages/topics/content that can be made more robust to improve rankings.
By then looking at what these losses mean in real dollars, you can set goals that you tie back to expected ROI.
When communicating with a client, you can frame recommended tactics around these pages as work to stem losses that might continue without intervention.
Especially in highly competitive verticals, there can be an arms race for the top-ranking spots, which necessitates constant investment on key pages and topical sectors to maintain rank.
Go After Keywords Within Striking Distance
In setting goals with ROI in mind, one tactic can be to examine those keywords and their associated pages that are within striking distance to the top ranking – pages that rank lower on the first page and are capable of reaching Position 1.
You can segment your data to show you what the potential revenue gains might be if these select keywords were to gain top rankings.
This investment will typically be a function of content improvements, UI/UX improvements, and link building. Budget can be set by understanding what your return will be if you achieve your goal.
You can also do this same calculation but grouped by page, which will allow you to have a rough estimation of which pages might benefit most from continued improvement and authority building.
The end goal of this type of top-level, page-specific calculation is to identify pages whose upward mobility can have the greatest impact value-wise. It can also hint at where improving authority and earning links could have the biggest impact.
Investigating Links
Links are highly important to establishing or maintaining the authority of a page. This is especially true for competitive topics and keywords sets.
Knowing that part of your prescription to stimulate growth will include earning links and building authority, it can be very helpful to know which pages are experiencing a loss of linking root domains when setting goals with ROI in mind.
There is a direct correlation to loss of unique linking domains and the loss of traffic or hard-earned rankings. This is especially true for those with ULDs with high authority.
When you find the pages that have seen a loss of links and are also important to a client’s site monetarily, you can set goals for improving that page.
Developing more robust content to enable new links for these pages is the straightforward way to improve your rank.
You can also then make estimations about the value that will be created as a result of ranking improvements. This is helpful in setting budgets for link acquisition and content development targeted at specific pages or topical categories.
There are two ways you can go about finding pages that are having issues with link attrition.
Method 1: Referring Domain Totals
Tools like Ahrefs can provide you with URL-specific data about referring domain totals.
This data is updated frequently and you are able to collect daily link counts for at least a year.
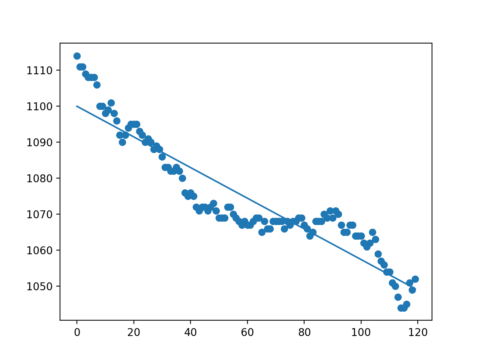
In most applications, you examine unique linking domain counts for each URL in a site over two, six, and eight months, respectively.
By plotting each unique linking domain count over a time period, you can perform a linear regression on the data.
You can then obtain a trend of the data points, which allows you to sort and compare the upward or downward link-count trajectories of each page on a domain.
Because you also have data about which pages produce the most potential revenue in dollars for a client, you can organize your data to filter the most impactful pages.
This allows you to isolate from your data a select group of pages that have lost significant link volume and whose positioning and ranking are also highly important to the financial productivity of the website.
Here is an example of the plotted unique linking domains (ULD) counts and the corresponding linear regression:
Method 2: High-Value Pages
Another method you can use to identify pages that have had significant attrition of authority is to look at the aggregate value that a link has, or as it’s commonly called, link equity.
In the same way as before, you can look through the data to identify key pages that have high value (bring in top dollars) but that have had (or will have) a likely degradation of their overall domain authority (DA).
You can get this data with tools provided by Ahrefs.
In this instance, instead of looking at the slope of the overall total ULD trajectory (positive or negative and to what degree) like you did in method 1, you can sum the DA of new and lost links to a page to predict if a page has or will soon be impacted by large aggregate changes to their perceived authority because of the changes to the link portfolio.
For example, a given high-value page might have 50 ULDs. Perhaps the distribution of DA for links pointing to that page is 5% with a DA of over 60, with even distribution of other DA links.
It’s important for you to know if high DA links are gained or lost, as they could have an inordinately strong impact on the overall authority of the page.
Your approach then is to average the DA gained and lost over various time periods. When you see high average losses, you can identify those pages that could benefit from regaining some of the strong links they may have lost.
You can also identify pages that may soon take ranking hits as a result of lost, high-authority links.
Note: Averaging the DA of inbound links is slightly more complicated than a normal averaging scenario because DA is a logarithmic scale. In other words, a DA 90 link is not the same value as nine DA 10 links.
In order to get a rough average of the trajectory of gained or lost DA for a page, you collect the incremental new and lost links, their respective DA, and then find the average of these logarithmic values.
You do this while consuming API data from Ahrefs using Python’s NumPy library, which makes averaging these log values fairly straight forward.
In the end, you can identify pages that have lost a significant volume of links or have a link attrition trajectory that corresponds to ranking losses.
You can also understand which pages have lost highly-valuable links, or in aggregate terms, have lost more total DA as the result of changes in their link profile.
It’s surprising that some pages that have a positive growth trajectory when looking at total unique linking domains. But, when you see the quality of those unique linking domains, you find that higher volumes of new links aren’t making up for losses of higher-value links for the same page.
The ROI of Ranking in Google Search
We’ll never be able to measure ROI of ranking in Google search down to the dollar.
However, using these strategies, you can clearly illustrate the value of prioritizing organic search, especially in a relative way.
Use these methods to justify your spend, adapt your budgets for the future, and highlight your past successes.
Source Credit https://www.searchenginejournal.com/ranking-google-organic-search-roi/327411/