How to Use Google Analytics: Getting Started
Do you need a deeper understanding of Google Analytics?
Do you know what data each section of Google Analytics offers?
A few important details and settings can improve your Google Analytics reporting.
In this article I’ll share the basics of navigating Google Analytics and what you need to set up now to make the most of its data.
Google Analytics Home
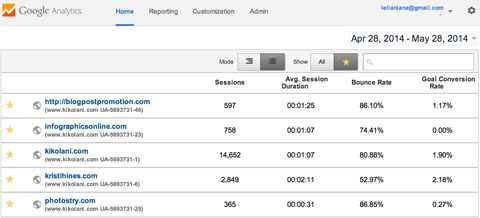
The Google Analytics home screen.
When you log into Google Analytics, you end up on the Home page where you can see a list of all of the websites you have set up in your account. This list shows you some basic data right off the bat such as your number of sessions, average session duration, bounce rate and goal conversion rate.
If you have a lot of websites like I do, you can use the search box under the date range to search for a particular domain. If you only want to view the domains that are most critical to your business, you can mark them with a star and change the Show settings to list only the starred websites.
You can use the date range to see your data over any specified time period. You can also use it to compare the current time period to a previous time period to see the change in sessions, average session duration, bounce rate and goal conversion rate.
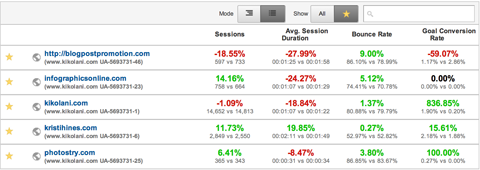
Comparing basic data across your top websites.
Since the data for each website changes to reflect the compared timeframes, it’s easy to see which of your websites are getting more or less traffic and conversions.
To view more data about a particular website, just click on the corresponding link and you’ll see the Google Analytics Reporting page.
Google Analytics Reporting
The Google Analytics Reporting page shows your Audience Overview data.
At the top of the screen, you’ll see the basic Google Analytics menu bar that allows you to go back and forth between the Home page, Reporting, Customization (reports) and Admin section. Further to the right, you can switch to another website within your Google Analytics account.
On the left sidebar, there is a search box to help you find specific reports and a list of links to important areas of your Google Analytics.
Here I will discuss about each option available in left sidebar.
Dashboards
Dashboards allow you to create customized views of your Google Analytics data using widgets. It’s a great way to see specific subsets of data without having to navigate through your standard reports.
You can add widgets to your dashboards using the +Add Widget button or by adding widgets as you browse your standard reports using the Add to Dashboard link. You can also download ready-to-go dashboards in the Google Analytics Solutions Gallery.
Shortcuts
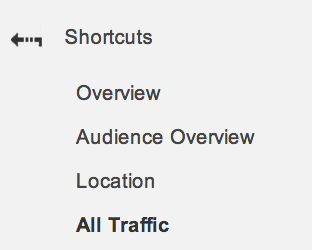 Shortcuts are simply that—links to your favorite Google Analytics reports. Whenever you’re viewing a specific piece of data in Google Analytics that you want or need to revisit often, click on the Shortcut link above it. This places it in your Shortcuts menu for future reference.
Intelligence Events
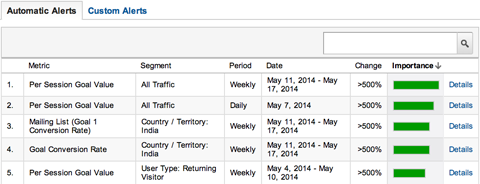 Intelligence Events are alerts you can set up within Google Analytics that email you when a specific event occurs. You can set up alerts for events like a dramatic change in number of sessions, goal conversions or other metrics within a daily, weekly or monthly timeframe. Here are Google Analytics Intelligence Events examples.
Real-Time
Want to know who’s on your website right now? Real-Time data gives you access to that data instantly.
Audience Through Conversions ReportsYou can see current visitors’ pageviews, active pages, locations and more.
The meat of your Google Analytics data is found in the Audience, Acquisition, Behavior and Conversions sections. These are the in-depth reports on your users, traffic sources, content and goal completions.
Chances are, you’ve toured most of these reports in the past. I’ll be writing about the data and benefits of each of these sections in upcoming posts here at Social Media Examiner.
Google Analytics Standard Reporting Views
Each subsection of the main sidebar options offers a standard report. When you’re viewing a standard report, you will likely see the following: the report name (e.g., Language), the date selector and a standard toolbar with options that allow you to customize the view, email the report, export the report data to various spreadsheet formats or PDF, add the report to your dashboard or create a shortcut to the report.
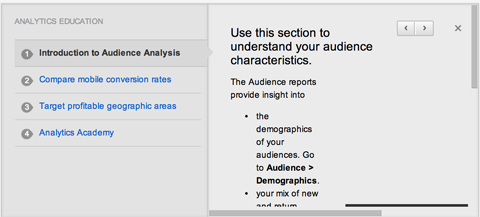
When you see the graduate hat beneath the date selector in the toolbar, you can click on it to learn more about the data within that specific report (as shown below).
Under the toolbar menu, there are two options. All Sessions shows you your data throughout Google Analytics as a whole, and +Add Segment allows you to see your data based on certain criteria, such as direct traffic, search traffic, mobile traffic and so forth.
On the +Add Segment page, you can use the +Create New Segment option to create your own criteria, such as traffic from the US or traffic that entered your website on a specific landing page.
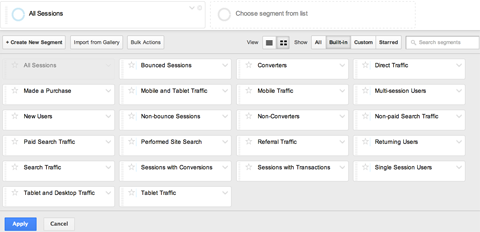
You can see a great post on how to use segments to track social media traffic by Eugen Oprea and download ready-to-go segments in the Google Analytics Solutions Gallery.
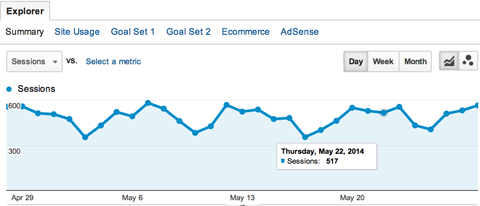
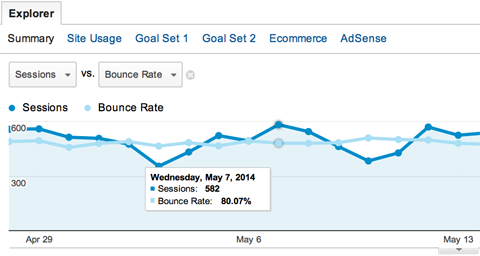
Looking at All Sessions, you’ll see the data specific to the report you’re viewing. Most reports start with an Explorer timeline view.
At the top of the Explorer view is the option to switch between Summary, Site Usage, Goal Sets, Ecommerce and AdSense.
The Summary view is the default and shows the Acquisition, Behavior and Conversions data for the data being reported. In the example below, this would be the data for visitors who speak a particular language.
If you have several goals set up for your website, use the Conversions drop-down menu to change the data to a different goal.
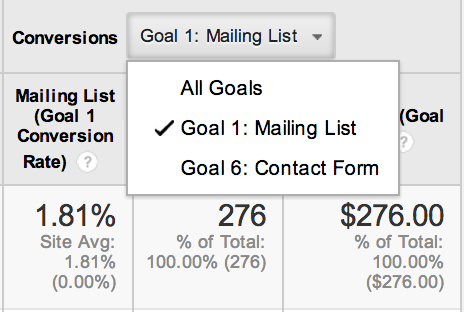
Use the Conversions drop-down to show a particular goal.
The Goal Sets view shows you the overall goal conversion rate for goals within a set (you can have four goals per set), per-session goal value and individual goal conversion rates for each goal in a set. (We’ll talk about setting up goals toward the end of this post.)
The Ecommerce view shows you revenue, transactions, order value, ecommerce conversion rates and per-session value for the data reported. In order to receive this data, you need to have set your website up with ecommerce tracking, which you can learn about in the Google Analytics Help Center.
The AdSense view is for publishers who have Google AdSense set up on their website. This shows you data for AdSense revenue, ads clicked, page impressions, CTR and eCPM for the data reported. To receive this data, you must have your AdSense account linked to your Analytics account.
Beneath the Explorer view options is a drop-down for Sessions vs. [Select a Metric]. Use these drop-downs to see different data comparisons within your report, such as Sessions vs. Bounce Rate.
To the right of these drop-downs, you can change your data view to daily, weekly or monthly and change the timeline to a more detailed chart or graph view.
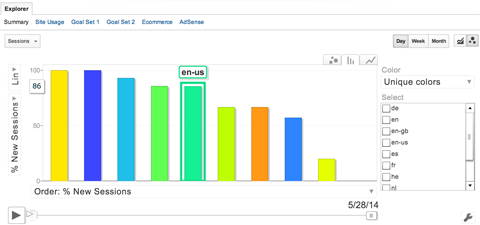
Additional Explorer graph and chart views.
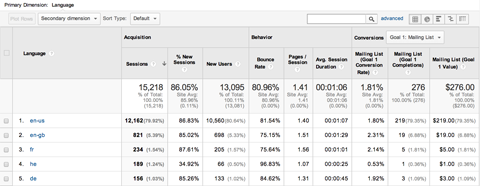
For example, let’s assume you’re viewing the en-us Language report (Audience > Geo > Language > en-us) and want more detailed information about the top sources of traffic for English – United States users.
Click on Secondary Dimension, choose Acquisition from the menu and then choose Source. The table data now shows you the data you want.
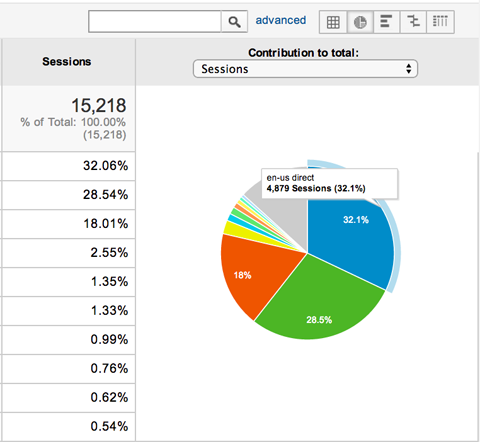
At the top right of the table, you can change the view to different charts and graphs. For example, you can change to the pie chart view and see that most users come to the site via direct means (no referring website, search engine or social network) and speak English – United States.
You can also click on the Advanced link next to the search box to filter specific dimensions and languages within the table. For instance, you can show only users who have a Bounce Rate less than a certain percentage to find out which languages and related traffic sources have the lowest bounce rates.
At the bottom right of the table is a drop-down to show more rows. This allows you to see more than the default top ten reported data types within your table.
Last but not least, within the table view, be sure to click on links within your table. These allow you to drill down to particular subsets of data.
For example, if you are in the Location Report (under Audience in the left sidebar), the table shows which countries the majority of your sessions are happening in. If you click on United States, you’ll see the States breakdown of your traffic. If you click on a state, you’ll get the top cities.
The same happens if you click on links within the table under the All Referrals report. Instead of just seeing the domain that is sending you traffic, you can see the pages within the domain sending you traffic.
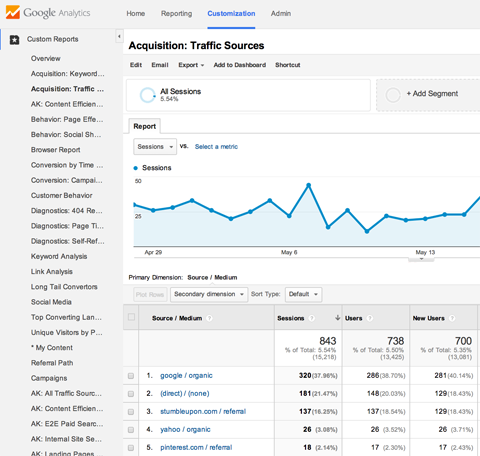
Google Analytics Customization
The next main item in the top menu bar is Customization. The benefit of using a Custom Google Analytics report is that you can see an exact portion of your Google Analytics data and have it emailed regularly to contacts you choose.
You can create new reports on your own, organize them by category and import reports from the Google Analytics Solutions Gallery.
Google Analytics Admin
The last main menu item in the top menu bar is the Admin menu. This is where you manage all of the settings for your website within Google Analytics. You can find a full breakdown of everything you can manage—from accounts to data filters—in the Google Analytics Help Center.
Two Features You Need to Start Using Now
Before we conclude your tour of the what’s what in Google Analytics, there are two things you should start using right now (if you aren’t already) to truly get value from your Google Analytics: Goals and Custom Campaigns.
#1: Google Analytics Goals
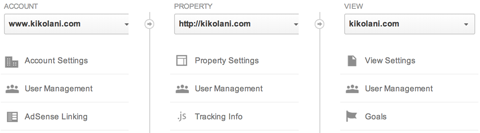 In the Google Analytics Admin menu under View, you have the option to set up goals for your website.
Google Analytics Goals, as mentioned earlier, help you track the data related to a user completing a specific action on your website.
The simplest goal type is the Destination goal. This type of goal allows you to say that when a user reaches a specific page on your website, a specific goal has been completed. Here are a couple of easy examples.
Example 1: If you have a mailing list, create a custom page on your website that thanks users for subscribing after they submit their information. Then set up that page as a destination goal called Mailing List (or something you will easily recognize as a mailing list conversion).
Example 2: If you have a contact form on your website that you use to capture leads for your business, create a custom page on your website that thanks users for submitting their contact information. Then set up that page as a destination goal called Contact Form (or something you will easily recognize as a contact form conversion).
Example 3: If you have a shopping cart on your website to sell products, you likely have an order confirmation or thank-you page that users land on once they’ve successfully completed an order. Set up this page as a destination called Shopping Cart (or something you will easily recognize as a shopping cart conversion).
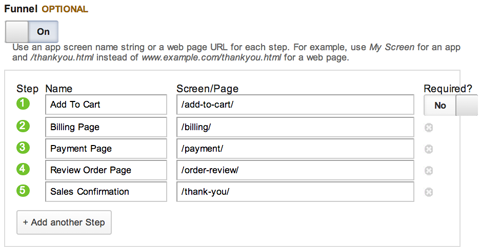
If there are specific pages that shoppers land on throughout the shopping cart process, you can turn on the Funnel option and include those pages as well. This allows you to track which pages in your funnel get the most abandons so you can optimize your shopping cart for more sales.
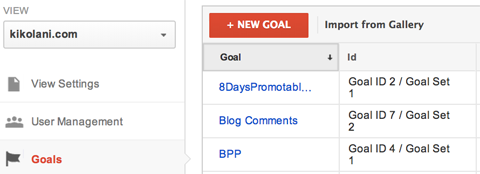
To set up a destination goal, click on Goals from the Admin panel, then click on the +New Goal button.
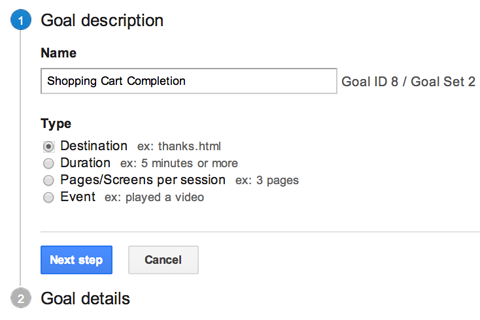
Name your goal and choose Destination as the type, then click Next Step.
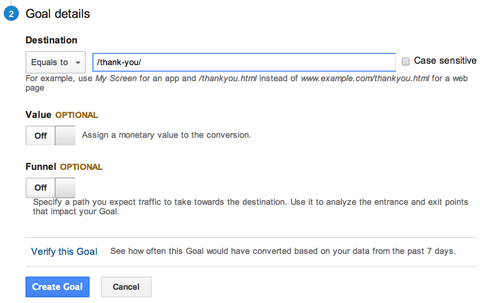
Enter your goal details. If your thank-you page is always http://domain.com/thank-you/, enter /thank-you/ as the web page URL and leave the drop-down set to Equals To.
If your thank-you page URL has appended tracking information added to it, then change the drop-down to Begins With and enter /thank-you/ as the web page URL.
To find out if your new goal is working, you need to submit your opt-in form, contact form or make a purchase in your shopping cart.
The two optional items in your goal details are Value and Funnel. If you know a specific value for each goal completion (e.g., the average order through your shopping cart is $10), then you can add that as a value. Otherwise, leave it blank.
If you have a shopping cart with specific pages that a user will visit throughout the process of purchasing a product, you can add them under Funnel.
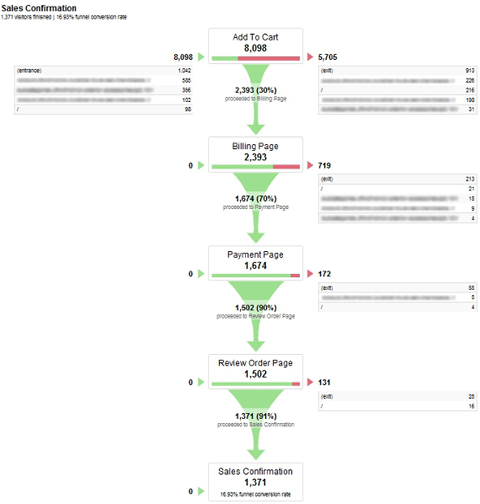
You can view your sales funnel(s) in the standard Funnel Visualization report.
Once you’re finished filling out the form, you can click the Verify this Goal link before saving your goal. If any users have completed the goal in the past seven days, you should get confirmation that your goal is set up correctly.
By setting up a Destination goal, you can measure ROI using your Google Analytics. You’ll be able to see which traffic sources and social networks send the most users to your website who complete a goal. You’ll be able to see which countries users who convert live in, and much more.
Aside from Destination goals, there are three other types. The Destination type is generally the easiest to set up and the most useful. You can learn about setting up the other types and their advantages in the Google Analytics Help Center.
#2: Google Analytics Custom Campaigns
Custom campaigns track visitors from specific traffic sources. Campaigns are set up using UTM parameters appended to the end of a URL a visitor would click on.
Google Analytics requires three parameters to track campaigns: the campaign medium (utm_medium), the campaign/traffic source (utm_source) and campaign name (utm_campaign).
For example, you can create a campaign to track traffic from a link shared through the Buffer app on Twitter.com, which is social media. In this case, social is your medium; twitter.com is your source; and buffer is your campaign name.
When someone clicks on a link shared by the Buffer app, they’ll see the following URL in their browser address bar:
http://iqtell.com/2014/02/are-we-managing-our-to-do-lists-all-wrong/? utm_medium=social&utm_source=twitter.com&utm_campaign=buffer
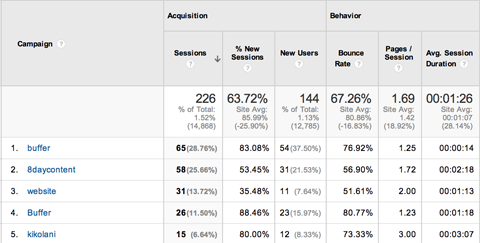
That link tells Google Analytics that someone completed your campaign parameters. You can see the results in the first entry in the Campaigns report below.
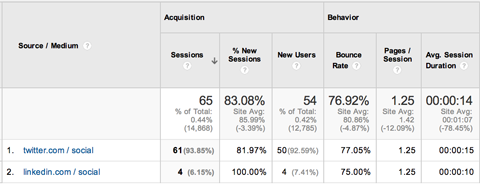
When you click on buffer (the campaign name) in the above example, you can see the source and medium.
Using campaigns, you can track visitors who come from just about anywhere, right down to those who clicked the third link in an email you sent to your mailing list on May 15.
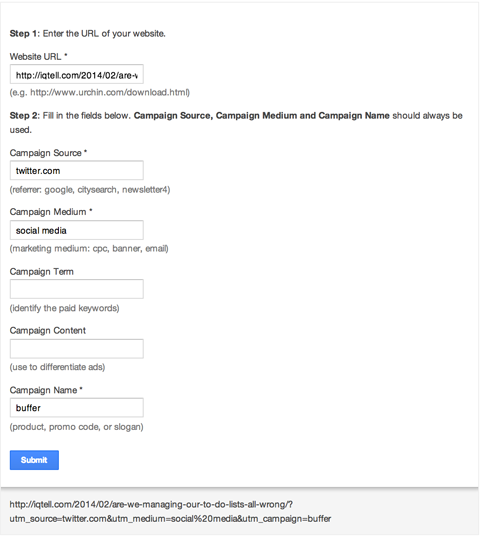
The best part about setting up these links is that you can do it easily using the campaigns URL Builder tool from Google. You just enter your URL, the campaign source, campaign medium and campaign name.
The key to accurately tracking campaigns is to keep your parameters consistent. Capitalization, spelling, spacing and punctuation must be exactly the same to always count as the same campaign within Google Analytics.
If you want to use buffer as a campaign name, be sure that you always use buffer, not Buffer or Buffer App, as those will be considered new campaigns. Or, if you’re going to use twitter.com as a source, always use twitter.com, not Twitter or Twitter.com, as Google Analytics considers each of those new sources.
Wrapping Up
I hope this has given you a good feel for navigating around your Google Analytics data, as well as a few to-dos to make that data worthwhile. In my next posts, I’ll be diving deeper into your Audience, Acquisition, Behavior and Conversions reports to show you how to analyze and utilize the data to improve your blog or business!
Source Credit https://www.socialmediaexaminer.com/google-analytics-basics/